1. Install plugin
Follow these steps to install the plugin on your iste:
- Download the Plugin: Log in to vizblock.com, go to My Account, and download the Vizblock .zip file.
- Upload in WordPress:
- In your WordPress Dashboard, go to Plugins > Add New.
- Click Upload Plugin, select the Vizblock .zip file, and click Install Now.
- Activate Vizblock: Once installed, click Activate Plugin. Vizblock will now be available in your block editor.
Note: You may need to enter your license key in the settings for updates and support.

2. Add the block
- Open the post or page where you want to add a chart.
- Click + Add Block and search for Vizblock.
- Select it to add the chart block to your page.
3. Upload your data
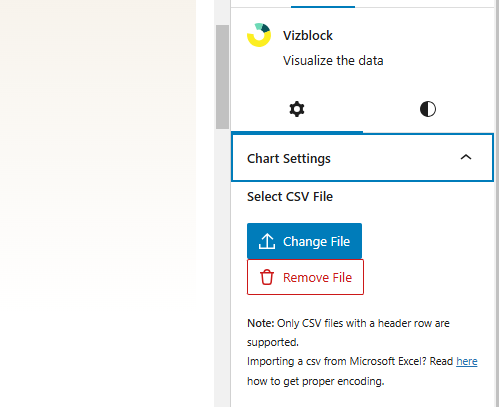
- In the Vizblock Chart block, click Upload Data.
- Select Upload CSV File and choose your CSV file.
- Ensure each column has clear headers for labels and data.
- Once uploaded, Vizblock will display your data for configuration.

3. Design your chart
- Choose a Chart Type: Pick from options like bar, line, pie, or scatter.
- Add Labels and Titles: Customize chart titles, axis labels, and legend settings.
- Style Your Chart: Select or customize themes, colors, and borders.
- Adjust Settings: Set dimensions, enable responsiveness, and toggle gridlines or rendering options.
- Preview and Publish: Check the preview, then save and publish to display your chart!
We hope you’re enjoying your new charts! If you have any questions, feel free to reach out to our support team.